“The Japanese market is too small to produce big returns” is a pessimistic view you often hear whispered in the startup world. But is it true?
To find out, we built our own dataset from public sources, tracking the post-IPO market capitalization of 352 VC-backed startups that went public on the Tokyo Stock Exchange Growth Market (and its predecessors) over the ten years from 2016 to 2025. In this post, I want to share what the data tells us about how far Japanese startups have actually come.
A bit of context for readers unfamiliar with Japan: Japanese startups tend to go public far earlier than their US peers. The TSE Growth Market (formerly Mothers) is a junior market designed for exactly this, and IPOs at valuations that would be a Series C or D in the US are common. As a result, much of the value creation that happens in late-stage private rounds in the US happens in the public markets in Japan. That is why you cannot understand Japanese venture returns without looking at what happens to a company after its IPO. We discussed this in detail in our article on “hidden unicorns.”
Note that we looked not only at current market caps but also at all-time highs since listing. It’s true that those highs include moments of hype driven by supply and demand. We deliberately included them. To see the full picture of how far Japanese startups have grown in the past decade, you need to know the highest price the market has ever been willing to pay for each company. (See the notes at the end for data sources and how we defined the universe.)
The data tells two stories. One is promising and the other shows there’s more work to be done.
A 100x opportunity existed in every vintage
First, we counted how many companies crossed each market cap threshold at their all-time highs.
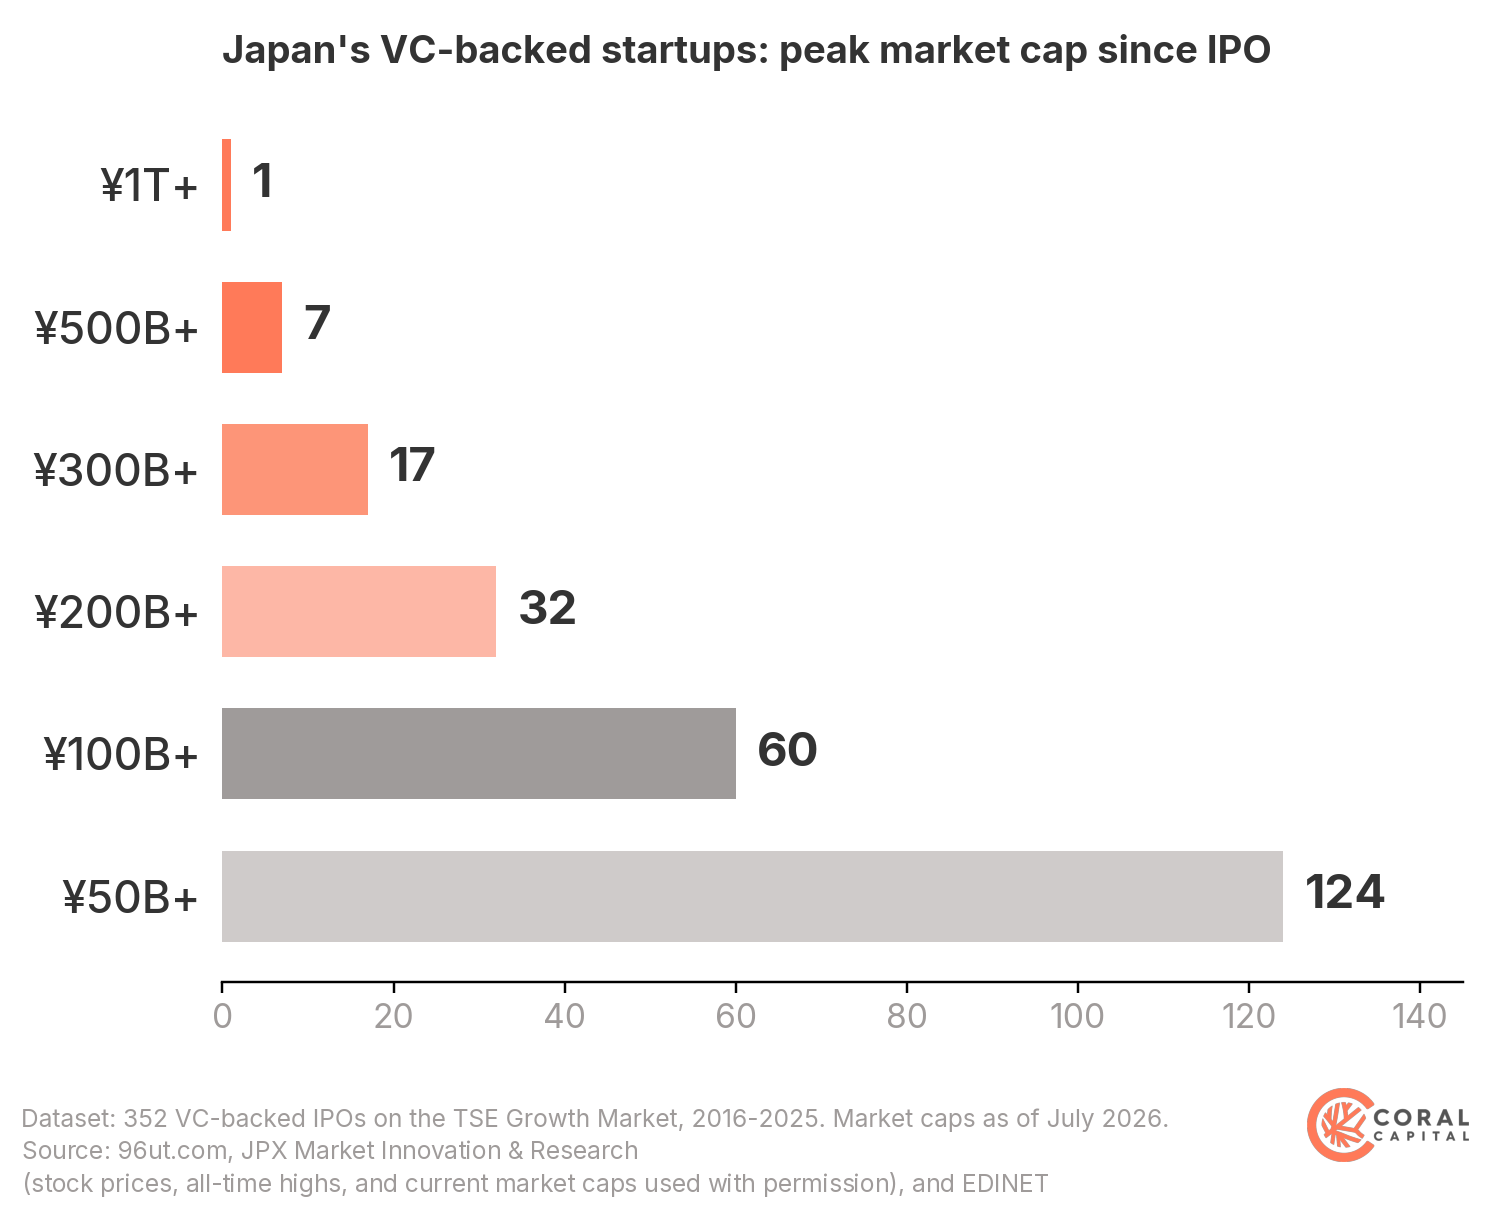
- Over ¥1 trillion (~$6.4B): 1 company
- Over ¥500 billion: 7
- Over ¥300 billion: 17
- Over ¥200 billion: 32
- Over ¥100 billion (~$640M): 60
- Over ¥50 billion: 124
In total, 60 companies crossed ¥100 billion. For context, this is the commonly cited threshold for “unicorn” in Japan; the recent JPY depreciation against USD has distorted things. When you see “¥100 billion,” think unicorn. Whether you find the “60 unicorns” number large or small depends on where you sit. What matters more is how stable it is over time.
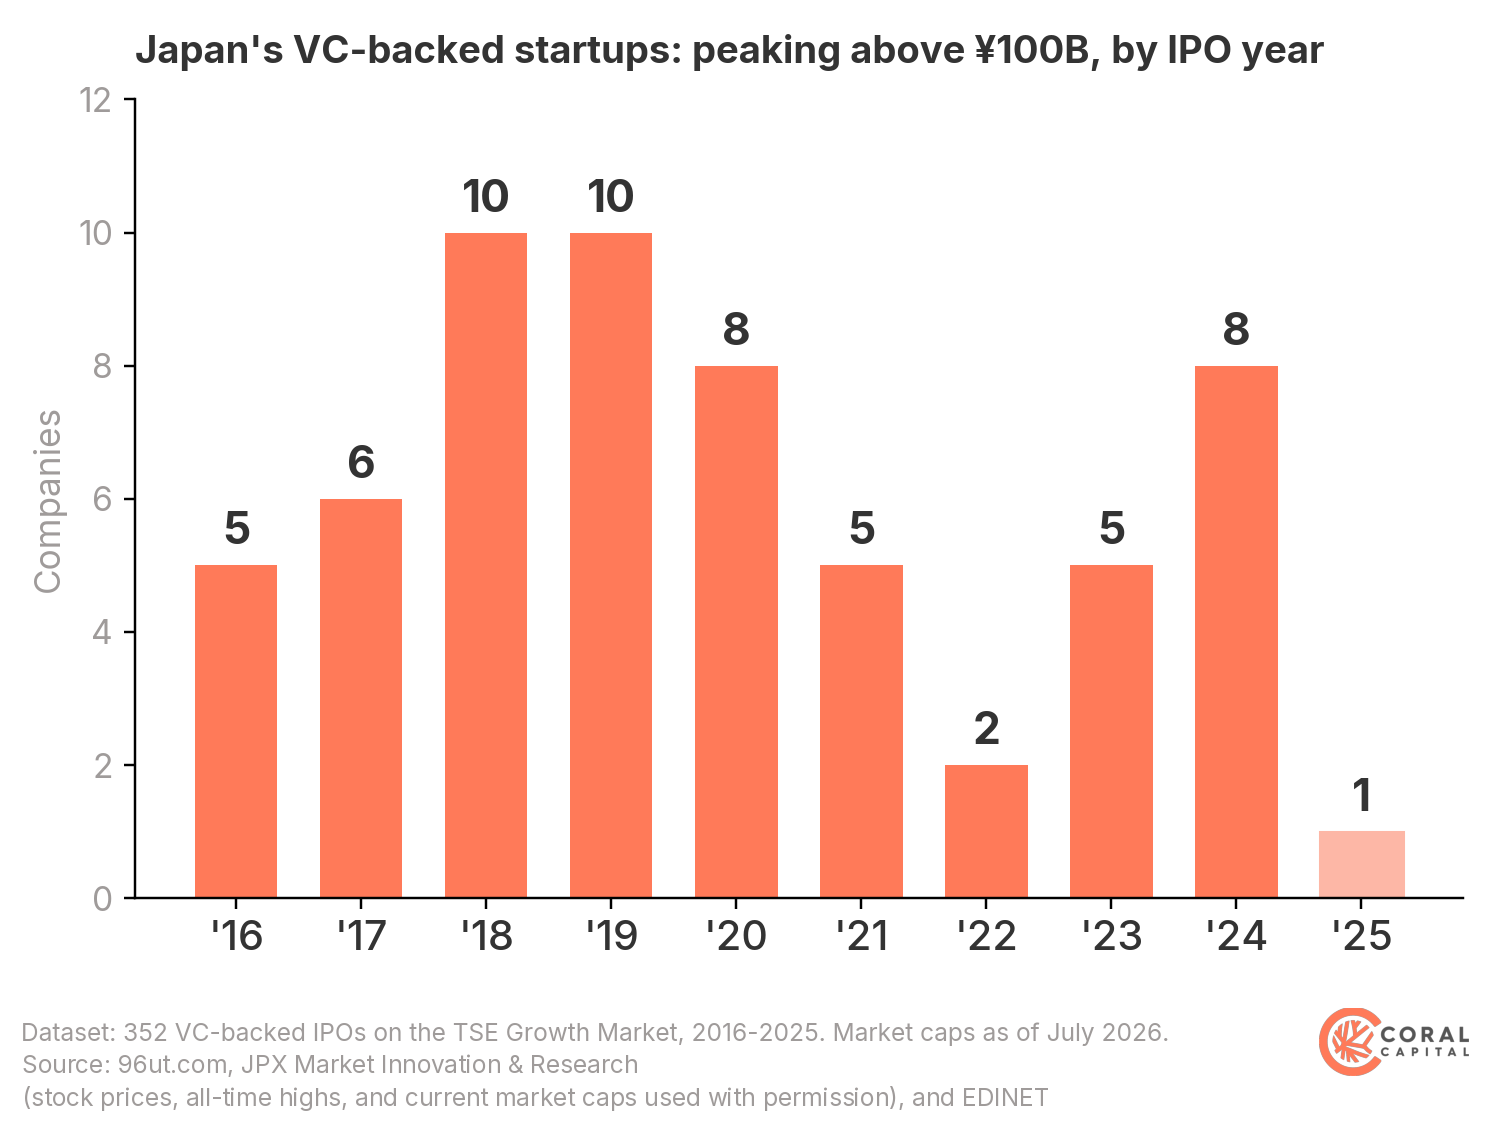
Broken down by IPO year, every cohort from 2016 to 2024 produced 5 to 10 companies that reached ¥100 billion at their all-time high (the exception is 2022, with 2) The 2025 is still too early to judge. The winners are not concentrated in one or two lucky years. Through market cycles, ¥100 billion companies have continued to emerge at a steady pace.
In VC terms, the math is simple. If you’d invested at a ¥1B valuation in a company that later hit ¥100B at its peak, that’s 100x. (This is a gross multiple ignoring dilution; your actual ownership return would be smaller, but it works as a rough gauge of opportunity size.) An entry at ¥1B would have hit 100x in 60 companies. At ¥500M, that number jumps to 124. Given that seed to early-stage valuations in Japan typically range from ¥500M to a few billion yen, a 100x opportunity existed across every vintage. The conventional wisdom we opened with, that Japan’s too small for big returns, clearly, is not quite true.
That said, let me be honest about two caveats. First, the fact that 60 such companies exist in hindsight is an entirely different thing from being able to pick those 60 in advance. The phrase “if you get the entry right” contains everything that is hard about venture capital. Second, all-time highs are fleeting. Among the 331 companies still listed, the median stock is down 71.4% from its high, and 81.3% of companies trade below half their peak. Only 2 companies remain within 10% of their all-time high. In other words, to actually realize a 100x return, you have to sell while prices are still at those highs. The opportunity existing and having the skill to seize it are two different things.
Some might object, “Aren’t those highs just the IPO pop?” It is true that across all 352 companies, about 40% hit their all-time high within 30 days of listing. But among the 60 companies that crossed ¥100 billion, only 15% (9 companies) peaked within 30 days. The big winners, for the most part, built their highs not on opening-day euphoria but on growth well after the IPO.
Even so, there’s a world of difference between a market with “no venture opportunities worth chasing” and one that has consistently generated them. Judged by all-time highs, Japan is the latter.
Only one company, Mercari, hit ¥1 trillion in the past decade
Now let’s look at the top rung of that ladder in Figure 1 again.
In ten years, 60 companies crossed ¥100 billion. Only 7 crossed ¥500 billion. Exactly one crossed ¥1 trillion. Japan has built the foundation to produce ¥100 billion companies consistently. Past that mark, the ecosystem thins out fast, and at the very top stands one company, Mercari, Japan’s dominant peer-to-peer marketplace, which listed in 2018.
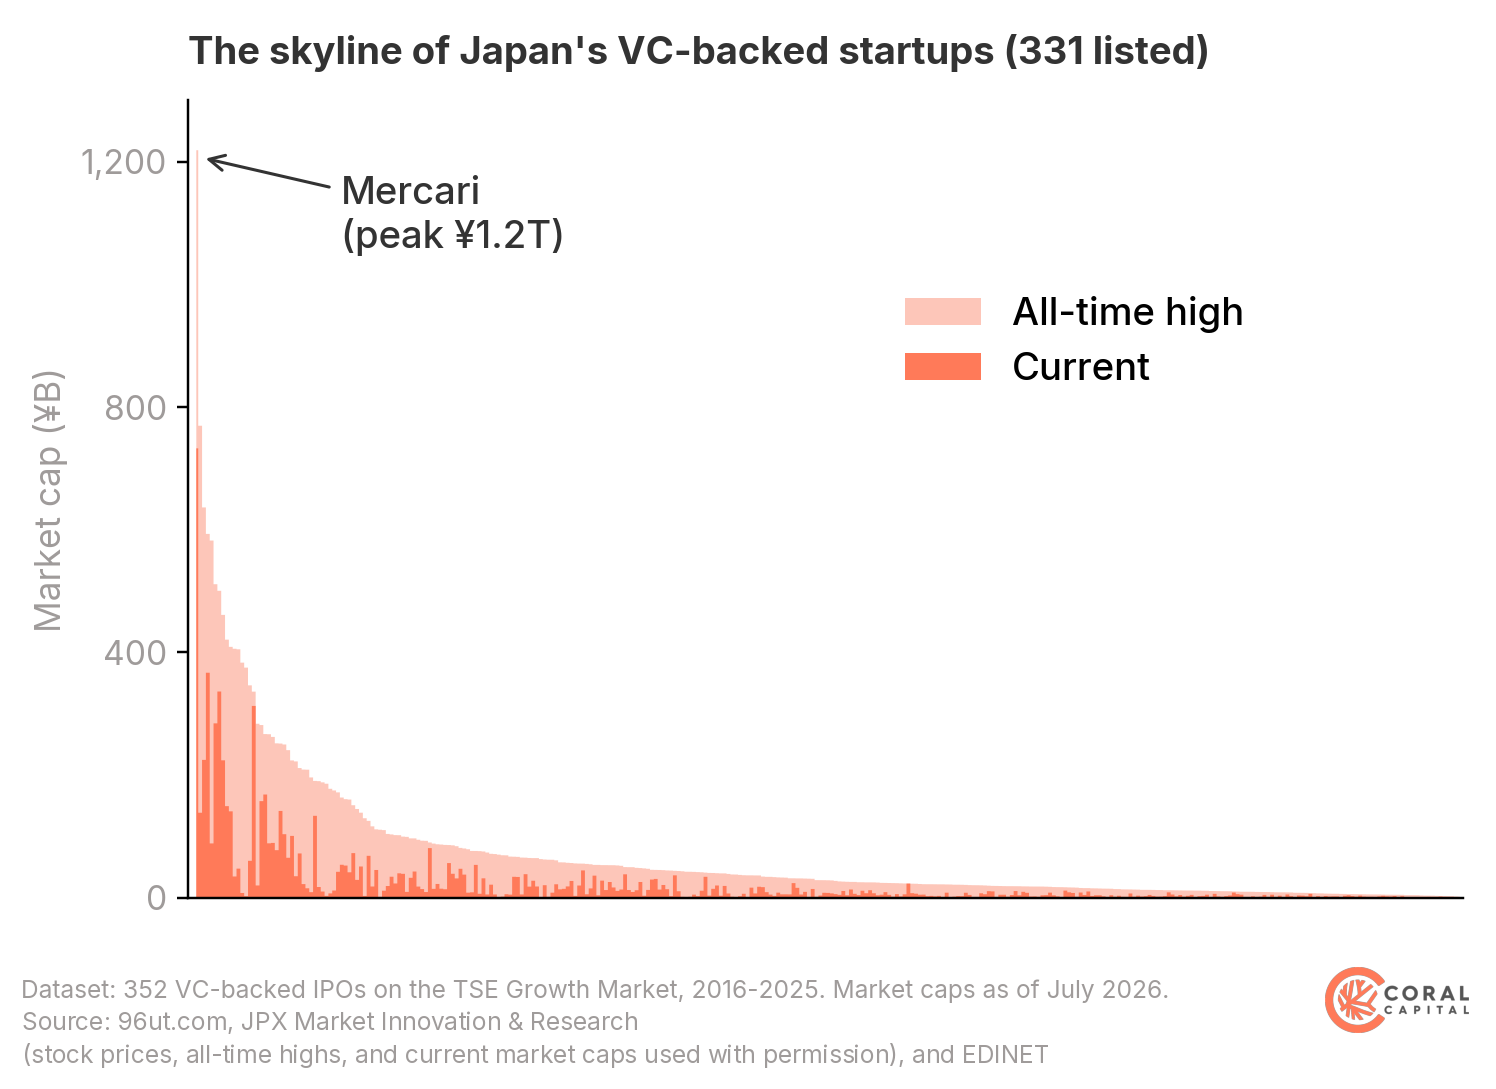
Line up the 331 listed companies by their all-time highs and you get this skyline. Mercari towers alone, followed by a long, low tail. This is the current shape of Japan’s startup ecosystem.
What’s more, Mercari hit its all-time high of ¥1.2 trillion back in November 2021. At the exchange rate at the time, that was over $10 billion, a genuine decacorn. Nearly five years have passed, and a second company has yet to appear. For Japanese venture, ¥1 trillion remains the outlier outcome; an N of 1.
Any VC telling Japan not to expect too much is in the wrong business
Whenever data like this comes out, you can expect to hear voices saying that Japan should have its own right-sized model of startup success, or that the trillion-yen (~$10B) benchmark is an American yardstick that does not apply here.
Personally, I disagree. Frankly, any VC telling Japan not to expect too much is in the wrong business. The venture capital business model is built on outliers. Most of the portfolio can fail as long as one breakout company returns the entire fund, which is why VCs can take large risks and tolerate many failures. Our job isn’t to bet on the average but to find and back the outliers. Not the long low skyline, but the towers that break through it. That is our reason for existing.
As my partner James has often put it, “America’s greatest strength is its irrational optimism, while Japan’s greatest weakness since 1989 has been its irrational pessimism.” That asymmetry matters. This data makes one thing clear. Japan’s pessimism has no basis in fact. 100x opportunities existed in every vintage, and ¥100 billion companies have continued to emerge. Which means we don’t even need irrational optimism. We can afford something better. Optimism grounded in data.
What’s missing is the next push. More founders who don’t just stop at ¥100 billion, but aim for ¥500 billion, then ¥1 trillion outcomes. We also need more patient capital to back them. A ceiling is only a ceiling until someone breaks it.
This is anecdotal, but since Mercari’s IPO, both the size of VC funds raised in Japan and the ambition founders talk about have clearly risen. At IPO, Mercari hit a market cap no VC-backed Japanese startup had reached before, breaking a ceiling in the process. When a ceiling breaks, the bar rises for the next generation.
Call us biased, but we’ll continue to bet that Japan can produce not just unicorns but decacorns ($10B+ companies), and we’ll keep searching for and backing the founders who dare to build them.
How do we break the ceiling?
If you take away anything from the 352 companies in ten years, let it be these two facts. The 100x opportunity has been there all along, but the ceiling is yet to be broken.
So how do we break it? Coral backs companies that take the Japan Advantage global from day one: strengths in manufacturing, energy, biotech, and content IP. The timing couldn’t be better. Capital and businesses are moving in both directions between Japan and the US at a scale we haven’t seen before. The US needs what Japan builds, and Japan needs US scale. As James put it in our 2026 thesis, the domestic market is no longer the ceiling. It’s the launchpad. (See also: If The US Wants Robots, They Need Japan and Accelerating Japan, With Anduril). I hope this data puts some numbers behind that thesis.
As for where the next generation of companies might come from, and how to spot the winning patterns in deep tech, I’d like to dig into that in a separate post. Stay tuned (subscribe here).
Data notes
- “VC-backed startups” in this post are companies whose pre-IPO shareholders included venture capital firms (no minimum threshold on VC ownership), based on 96ut.com’s IPO listings and prospectuses. From that set, we excluded (1) companies whose largest shareholder was a buyout or PE fund, (2) companies in the banking business, and (3) IPOs where an opening price was never formed, leaving 352 “pure VC” companies that IPO’d on the TSE Growth Market or its predecessors (formerly Mothers, etc.).
- Market caps and all-time highs are as of July 23, 2026 (based on the prior trading day’s close). All-time highs are split-adjusted through that date.
- Drawdown statistics use the 331 still-listed companies as the denominator (excluding 21 delisted companies).
- The “100x” calculation is a gross multiple that does not account for dilution.
- Exchange rate reference: approximately ¥156 = $1 (2025 year-end, roughly equal to the spot rate at the time of writing)
- Access to EDINET disclosure data (shares outstanding, etc.) was via EDINET DB, a service that makes EDINET filings easier to work with.
- Sources: 96ut.com (VC-backed classification, IPO listings), JPX Market Innovation & Research (stock prices, all-time highs, and current market caps used with permission), EDINET (shares outstanding). Compiled by Coral Capital.